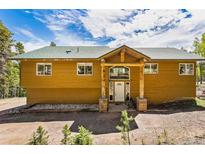
Below you can view all the homes for sale in the Hyland Hills subdivision located in Evergreen Colorado. Listings in Hyland Hills are updated daily from data we receive from the Denver multiple listing service.
To learn more about any of these homes or to receive custom notifications when a new property is listed for sale in Hyland Hills, give us a call at 720-298-6702.
4 Results
Hyland Hills Evergreen Colorado Homes For Sale
Hyland Hills Pended
$885,000
610 Meadow View Dr,
Evergreen,
CO
80439
*POTENTIAL GREAT VALUE
On Market For 16 Days
$6,000/month and the previous sellers generated some extra income via hipcamp.com with a fantastic camping site on this great acreage.
Landmark Residential Brokerage.

Hyland Hills For Sale
$1,699,000
1298 Meadow View Dr,
Evergreen,
CO
80439
Situated on over 1 acre - close to the elementary school and high school - easy access to I-70 - This home offers the best of both worlds - Quick access to Denver but the quiet serenity of the Rocky Mountains.
Coldwell Banker Global Luxury Denver.

Hyland Hills For Sale
$990,000
1295 Hy Vu Dr,
Evergreen,
CO
80439
What the owners love about this house: location, sunshine, views, wildlife, easy 45 minutes to Loveland and 30 to Denver, close to trails and bike park and the neighbors. Come see for yourself.
Keller Williams Foothills Realty, LLC.

Similar Properties For Sale
5336 High Rd


$750,000
MLS# 7317906,
Madison & Company Properties
29827 Gigi Rd


$759,000
MLS# 7327409,
Madison & Company Properties
54 Zaza Ln


$775,000
MLS# 7348103,
Keller Williams Action Realty ...
8795 Rudd Rd


$799,999
MLS# 7191474,
Coldwell Banker Realty 28
Nearby Properties For Sale
8 Yuma Trl


$745,000
MLS# 9426555,
Compass - Denver
Area Stats
These statistics are updated daily from the RE colorado. For further analysis or
to obtain statistics not shown below please call Highgarden Real Estate at
720-298-6702 and speak with one of our real estate consultants.
Popular Homes
$663,762
$499,950
125
1.6%
68.8%
89
$1,095,784
$725,000
243
0.4%
46.5%
83
$2,434,834
$1,698,500
564
0.0%
34.4%
72
$2,250,000
$2,250,000
2
0.0%
50.0%
27
$3,676,196
$2,447,500
98
0.0%
37.8%
107
$655,626
$549,990
413
1.9%
52.3%
61
$724,582
$665,000
21
4.8%
57.1%
102
$1,048,882
$799,700
727
0.0%
56.3%
69
$1,110,941
$915,000
127
0.8%
44.1%
62
$850,333
$690,000
225
0.4%
54.2%
83
$875,129
$800,000
326
0.0%
47.2%
77
$667,811
$621,000
92
1.1%
52.2%
50
$553,136
$499,900
113
0.9%
47.8%
101
$1,733,325
$1,750,000
59
0.0%
39.0%
62
$538,277
$533,900
121
2.5%
52.9%
74
$955,778
$849,000
9
0.0%
22.2%
47
$1,374,284
$1,185,000
262
0.4%
48.1%
63
$2,637,870
$2,000,000
71
0.0%
45.1%
47
$888,640
$875,000
25
0.0%
64.0%
89
$752,125
$698,000
51
0.0%
39.2%
63
$1,221,665
$799,950
20
0.0%
55.0%
88
$595,800
$525,000
5
0.0%
40.0%
59
$1,027,155
$874,990
136
0.0%
50.7%
67
$507,220
$509,900
35
0.0%
22.9%
50
$1,014,797
$674,950
454
0.0%
39.0%
61
$1,305,295
$1,258,000
118
0.0%
39.8%
61
$657,596
$574,995
80
0.0%
51.2%
75
$985,421
$875,000
143
0.0%
46.9%
57
$1,210,019
$972,396
120
0.0%
52.5%
71
$2,827,950
$2,495,000
40
0.0%
20.0%
61
$761,800
$674,500
26
0.0%
50.0%
58
$1,009,244
$749,975
24
0.0%
50.0%
98
$1,751,535
$1,195,000
37
0.0%
40.5%
78
$499,500
$499,500
2
0.0%
50.0%
84
$632,027
$499,500
54
1.9%
48.1%
126
$1,057,479
$1,025,000
62
0.0%
51.6%
77
$626,623
$520,000
39
2.6%
66.7%
58